
Description
Market Reversal Alert: Profit from Market Structure Changes
The Market Reversal Alert Indicator identifies when a trend or price move is approaching exhaustion and ready to reverse. This indicator alerts you to changes in market structure, which typically occur when a reversal or major pullback is about to happen. By recognizing these shifts, traders can take advantage of market reversals and profit from changes in price direction.
Features of the Market Reversal Alert Indicator
This indicator provides numerous features that enhance your trading strategy. It identifies breakouts and price momentum when a new high or low is formed near a possible exhaustion point. Additionally, it draws a rectangle on the last opposite-colored candle and trails this rectangle along with the price as it moves in its current short-term trend.
Once the price weakens enough to close above or below the rectangle, it indicates a potential shift in market structure. This alert suggests a possible reversal in trend or a major pullback.
Key Features
- Alerts to potential changes in market structure at key exhaustion points
- Automatically draws short-term market structure as price approaches exhaustion levels
- Trails alert rectangles behind price to find the tightest entries
- Changes color to a solid block rectangle on alerts to show potential reversals
- Works on all symbols and timeframes
- Integrated pop-up, push, and email alerts
- Alerts when a retest of a reversal alert occurs, confirming the entry
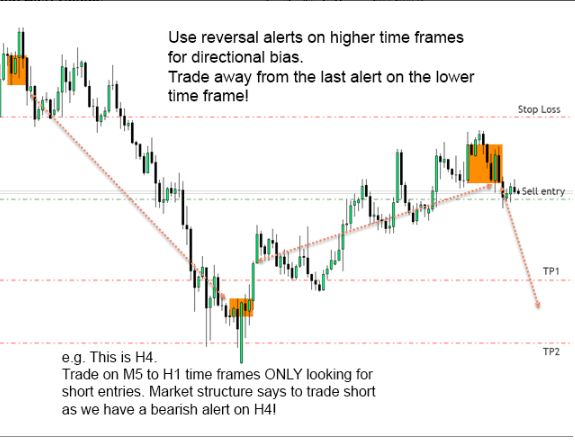
- Allows viewing higher timeframe reversal rectangles on lower trading timeframes
- Select all reversal alerts or just long or short alerts based on current trend direction
- View higher timeframe directional bias arrows on lower timeframe charts
Strategy & How to Trade with the Market Reversal Alert Indicator
When a reversal alert occurs, follow these steps:
- Look left! Check for a supply/demand or support/resistance level at the reversal point. Market structure shifts often happen when price retests an old level or after a stop hunt above a support or resistance level.
- Consult a higher timeframe to see if there is an area of support/resistance being tested. Changes in market structure on lower timeframes usually align with major levels on higher timeframes.
If the above conditions are met, place a trade in the direction of the reversal. You can add additional indicators for validation or use this indicator to enhance your existing strategy.
Stop Loss and Take Profit
Your stop loss should always be set just above the most recent high or below the most recent low. If the reversal correctly identifies a shift in market structure, the price will rarely move back above or below the most recent peak. The size of your stop loss depends on how aggressive the last move was.
For take profit, using a 1.5:1 or 2:1 risk to reward ratio is easily achievable. Alternatively, you can enter two trades and have one trail along with the price just above or below new rectangles as they appear on the chart, achieving a 5:1 or higher risk to reward ratio.
Visual Insights and Demonstration
Product Specifications
| Specification | Description |
|---|---|
| Indicator Type | Market Reversal Alert |
| Applicable Markets | All symbols |
| Timeframes Supported | All timeframes |
| Alerts | Pop-up, push, email |
| Key Features | Identifies market structure shifts, dynamic alert rectangles, higher time |


Reviews
There are no reviews yet.